
Here are some highlights of the coffee research at UC Davis that has been published across multiple fields:
Chemical Characterization of Potentially Prebiotic Oligosaccharides in Brewed Coffee and Spent Coffee Grounds
Oligosaccharides are indigestible carbohydrates widely present in mammalian milk and in some plants. Milk oligosaccharides are associated with positive health outcomes; however, oligosaccharides in coffee have not been extensively studied. We investigated the oligosaccharides and their monomeric composition in dark roasted coffee beans, brewed coffee, and spent coffee grounds. Oligosaccharides with a degree of polymerization ranging from 3 to 15, and their constituent monosaccharides, were characterized and quantified. The oligosaccharides identified were mainly hexoses (potentially galacto-oligosaccharides and manno-oligosaccharides) containing a heterogeneous mixture of glucose, arabinose, xylose, and rhamnose. The diversity of oligosaccharides composition found in these coffee samples suggests that they could have selective prebiotic activity toward specific bacterial strains able to deconstruct the glycosidic bonds and utilize them as a carbon source.
Effect of Roasting on Oligosaccharide Abundance in Arabica Coffee Beans
Emerging research into the bioactivities of indigestible carbohydrates is illuminating the potential of various foods and food streams to serve as novel sources of health-promoting compounds. Oligosaccharides (OS) are widely present in milks and some plants. Our previous research demonstrated the presence of OS in brewed coffee and spent coffee grounds. Armed with this new knowledge, the next step toward improving the utilization of these valuable components involved investigating the effect of roasting on the formation and abundance of coffee OS. In the present study, we used advanced mass spectrometry to analyze a variety of coffee samples and demonstrated that a great structural diversity and increased abundance of OS is associated with higher roasting intensity. The present investigation also evaluated methods for OS extraction and fractionation. A preparative-scale chromatographic method, based on activated carbon, was developed to isolate enough amounts of OS from coffee to enable future confirmation of prebiotic and other in vitro activities.
Titratable Acidity, Perceived Sourness, and Liking of Acidity in Drip Brewed Coffee
Acidity is a highly prized attribute in coffee, but there is little understanding of the brewing conditions under which acidity contributes favorable sensory attributes versus unfavorable sourness. Here, we examine the effect of titratable acidity and pH on the perception of sourness and consumer acceptance in drip brew coffee. Sour perception and acidity liking were assessed over a wide range of brew strengths and extraction yields at three different roast levels (light, medium, dark) and three different brewing temperatures (87 °C, 90 °C, and 93 °C). We find that perceived sour intensity correlates weakly with pH, but strongly with titratable acidity. Increases in titratable acidity also yielded increases in consumer perception of “too much acidity” and also impacted consumer liking and consumer preference segmentation with one cluster of consumers preferring more acidic coffee. Importantly, our data show that titratable acidity is linearly correlated with total dissolved solids (TDS) under all conditions studied, indicating that TDS is a good proxy for titratable acidity. The results presented here will provide the coffee industry with insight toward controlling perceived acidity or sourness, a key sensory attribute that substantially impacts consumer acceptance.
Sensory and monosaccharide analysis of drip brew coffee fractions versus brewing time
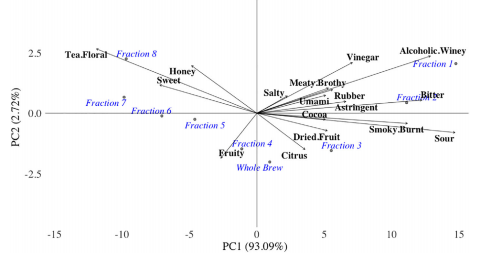
The composition of drip brew coffee versus brewing time has been chemically characterized in previous studies, and it is known that the total dissolved solids (TDS) systematically decreases with each fraction during the brew. Little information exists regarding the corresponding sensory attributes versus time, however, and it is unclear how TDS correlates with flavor profile. Standard drip brews were fractionated into distinct samples by switching in an empty carafe every 30 s during the brew. Using a trained sensory descriptive panel, we found that most taste and flavor attributes decreased with brew time; for example, the earlier fractions were systematically more bitter and more sour than later fractions. Surprisingly, however, several flavor and taste attributes increased in time; for example, later fractions were systematically sweeter and more floral than earlier fractions. Since later fractions had lower TDS, these results indicate that perceived sweetness in drip brew coffee is negatively correlated with TDS. Mass spectrometry measurements of the monosaccharide content in the brews showed that none of the fractions had perceptible concentrations of any monosaccharide. The results of the sensory analysis and the monosaccharide analysis suggest that perceptible sweetness in coffee is a consequence of masking effects and/or the presence of sweet-associated aromas and flavors. The results further suggest that unique flavor profiles could be obtained from the same coffee grounds by judicious combinations of specific fractions.
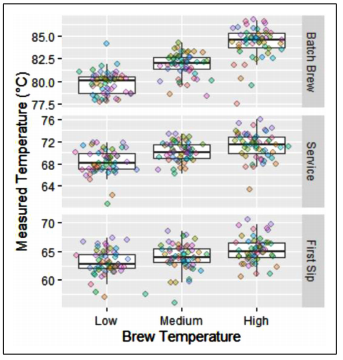
Brew temperature, at fixed brew strength and extraction, has little impact on the sensory profile of drip brew coffee
The brew temperature is widely considered a key parameter affecting the final quality of coffee, with a temperature near 93 °C often described as optimal. In particular, drip brewers that do not achieve a minimum brew temperature of 92 °C within a prescribed time period fail their certification. There is little empirical evidence in terms of rigorous sensory descriptive analysis or consumer preference testing, however, to support any particular range of brew temperatures. In this study, we drip-brewed coffee to specific brew strengths, as measured by total dissolved solids (TDS), and extraction yields, as measured by percent extraction (PE), spanning the range of the classic Coffee Brewing Control Chart. Three separate brew temperatures of 87 °C, 90 °C, or 93 °C were tested, adjusting the grind size and overall brew time as necessary to achieve the target TDS and PE. Although the TDS and PE both significantly affected the sensory profile of the coffee, surprisingly the brew temperature had no appreciable impact. We conclude that brew temperature should be considered as only one of several parameters that affect the extraction dynamics, and that ultimately the sensory profile is governed by differences in TDS and PE rather than the brew temperature, at least over the range of temperatures tested.
Consumer preferences for black coffee are spread over a wide range of brew strengths and extraction yields
Brewing is the final and key step in the production of the coffee beverage. Extraction related metrics such as the total dissolved solids (TDS), percentage extraction yield (PE) of solutes, and brew temperature (BT) are widely believed to govern the flavor and corresponding consumer acceptance of the resulting brew, as summarized in the industry standard “Coffee Brewing Control Chart.” In this study, we investigated how the three factors of TDS, PE, and BT affected consumer acceptance of a medium roast, single-origin coffee and whether consumer preference segmentation would be observed based on these variables. A cohort of 118 mostly college-age, self-reported consumers of black coffee tasted coffees that varied in BT, TDS, and PE. For each coffee, consumers rated overall acceptance on the 9-point hedonic scale; the adequacy of serving temperature, flavor intensity, acidity, and mouthfeel using 5-point just-about-right (JAR) scales; and described the flavor using a check-all-that-apply list of 17 attributes. Cluster analysis revealed two consumer segments whose preferences varied most strongly with TDS.Response surface methodology relating liking to TDS and PE produced dome- and saddle-shaped surfaces for the two segments, respectively. External preference mapping and penalty analysis indicated that overall flavor intensity as well as acidity heavily influenced the preferences of the two clusters. The Coffee Brewing Control Chart’s “ideal” coffee should therefore be reconsidered to reflect consumer preference segmentation.
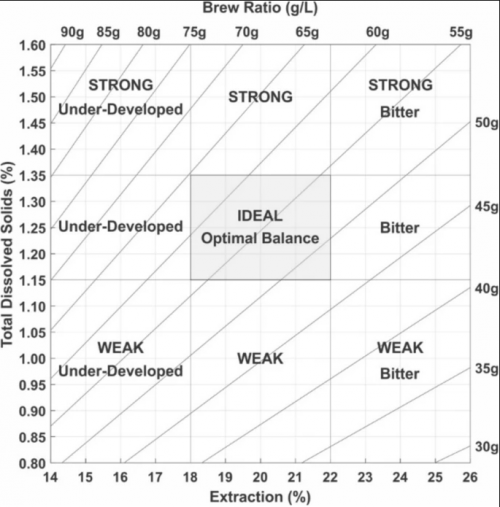
Effects of brew strength, brew yield, and roast on the sensory quality of drip brewed coffee
Drip brewed coffee is traditionally quantified in terms of its strength, also known as total dissolved solids (TDS), and its brewing yield, also known as percent extraction (PE). Early work in the 1950s yielded classifications of certain regimes of TDS and PE as “underdeveloped,” “bitter,” or “ideal,” with the modifiers “weak” or “strong” simply correlated with TDS. Although this standard is still widely used today, it omits a rich variety of sensory attributes perceptible in coffee. In this work, we used response surface methodology to evaluate the influence of TDS and PE on the sensory profile of drip brewed coffee. A representative wet-washed Arabica coffee was roasted to three different levels (light, medium, or dark), with each roast then brewed to nine target brews that varied systematically by TDS and PE. Descriptive analysis found that 21 of the 30 evaluated attributes differed significantly across the brews for one or more experimental factors, yielding linear or second-order response surfaces versus TDS and PE. Seven attributes exhibited a significant response surface for all three roast levels tested: burnt wood/ash flavor, citrus flavor, sourness, bitterness, sweetness, thickness, and flavor persistence. An additional seven attributes also showed a significant response surface fit across some but not all roasts. Importantly, sweetness exhibited an inverse correlation with TDS irrespective of roast, while dark chocolate flavor and blueberry flavor decreased with TDS for medium roast. These results provide new insight on how to optimize brewing conditions to achieve desired sensory profiles in drip brewed coffee.
An equilibrium desorption model for the strength and extraction yield of full immersion brewed coffee
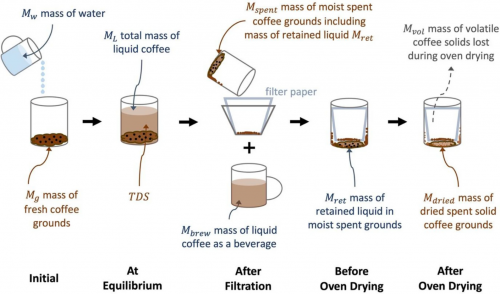
The sensory qualities of brewed coffee are known to be strongly correlated with the total dissolved solids (TDS) and extraction yield (E) of the brew. Here, we derive a predictive model for the TDS and E of full immersion brewed coffee using a pseudo-equilibrium desorption approach. Assuming a single, species-averaged equilibrium constant KK yields theoretical predictions indicating that the TDS is approximately inversely proportional to the water/coffee mass brew ratio, while E is independent of the brew ratio. Our experimental results strongly accord with both theoretical predictions, and indicate that E is approximately 21% over a wide range of brew ratios. An analysis of the standard oven-drying method for measuring E indicates that it yields significant underestimates of the true value at equilibrium, due to retained brew within the spent moist grounds. We further demonstrate that KK is insensitive to grind size, roast level, and brew temperature over the range 80–99 °C. Taken together, our results indicate that full immersion brewing offers precise control over the TDS at equilibrium but little control over E, and that practitioners should pay careful attention to their brew ratio as the most important parameter for full-immersion brewing.
A comprehensive analysis of operations and mass flows in postharvest processing of washed coffee

Although coffee is one of the most valuable and widely traded agricultural commodity in the world (US$83 billion in 2017 revenue), little information exists in the scientific literature regarding coffee bean postharvest processing. In particular, sustainability analyses require information on the coffee bean mass and property changes during processing, from harvest to final consumption. In this study, a detailed analysis of the washed or wet-processed method for coffee postharvest processing is provided. Mass flow data were collected through site visits, surveys, laboratory measurements, and interviews with coffee wet and dry mill operators in several countries throughout Central America and Mexico, as well as roasters and cafés in the United States, to establish representative mass flow rates and process flow diagrams from harvest to cup. Results indicate that 100 kg of harvested coffee cherries will on average yield 2.6 kg of mass consumed by humans as exported coffee, equivalent to approximately 839 metric cups (250 ml) of drip brew coffee or 897 metric shots (30 ml) of espresso. The remaining 97.4 kg provide opportunities for development of alternative products, and other economic uses. Importantly, the data suggests that more mass is lost during depulping in practice than previously indicated by laboratory measurements. This study provides a foundation for further investigations in the fields of equipment improvement, byproduct utilization, and environmental and economic sustainability of the coffee processing and distribution chain.
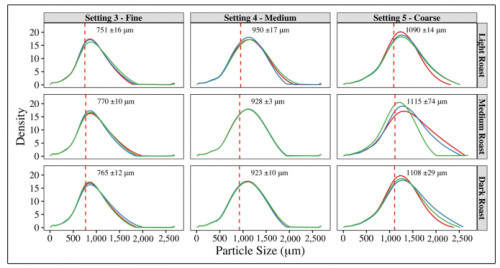
Effect of Basket Geometry on the Sensory Quality and Consumer Acceptance of Drip Brewed Coffee
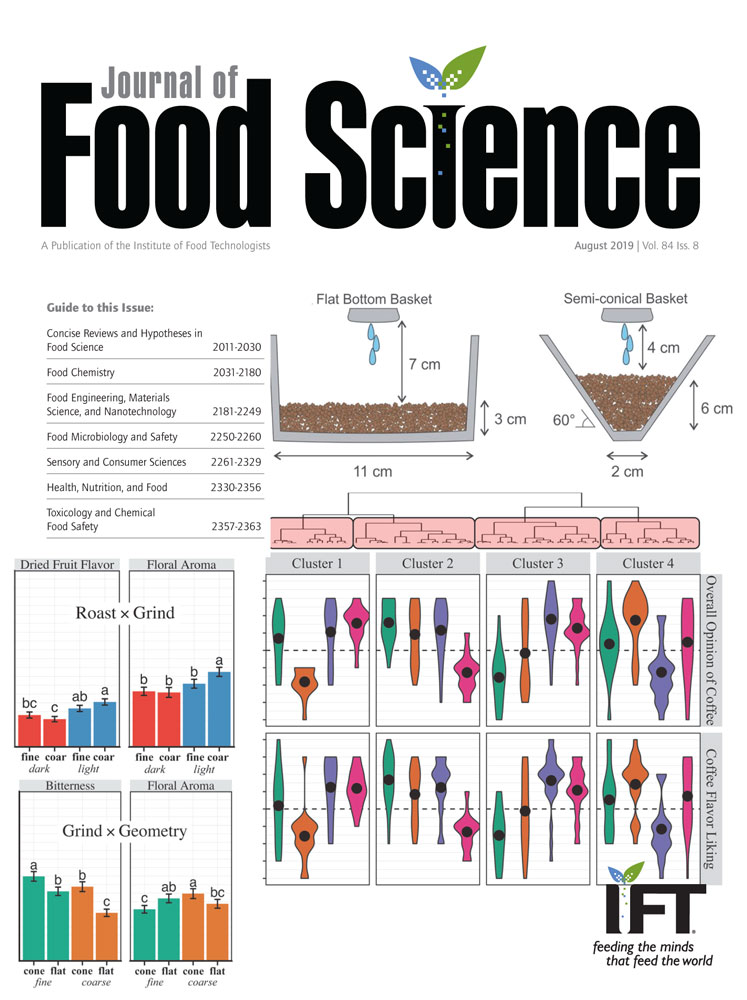
In this work, discrimination tests, descriptive analysis, consumer tests, and total dissolved solids (TDS) were used to evaluate the effects of brew basket geometry on the sensory quality and consumer acceptance of drip brewed coffee. Two basic geometries, semi‐conical and flat‐bottom, were evaluated in conjunction with coffee roast and particle size. Initial discrimination tests showed that small differences in median particle size were not discernable, but that coffees brewed using either semi‐conical or flat‐bottom filter baskets were significantly different (P < 0.05, N = 45). Additionally, coffee brewed in the semi‐conical basket had significantly higher %TDS, and we estimated a sensory difference threshold of 0.24 %TDS. A subsequent descriptive analysis (DA) showed significant differences by roast for 11 attributes and by grind for six attributes. Although brewing geometry, as a single factor, was only significantly different for three independent attributes (smoke aroma, sweetness, and tobacco flavor), roast × geometry interactions were significant for six attributes (berry flavor, bitterness, burnt wood/ash, citrus flavor, earthy flavor, and sourness) and the grind × geometry interaction was significant for two attributes (bitterness and floral aroma). Attributes showing significant interactions with brewing geometry were also key drivers of consumer liking/disliking. Overall consumer liking (9‐point hedonic scale) was analyzed by cluster analysis (N = 85), which revealed four distinct preference clusters. For each cluster, a particular basket geometry and/or roast level showed lesser acceptance. Overall, the results strongly corroborate the hypothesis that basket geometry affects the sensory quality of drip brewed coffee.
Genetic diversity and re-classification of coffee (Coffea canephora Pierre ex A. Froehner) from South Western Nigeria through genotyping-by-sequencing-single nucleotide polymorphism analysis
Coffea canephora is an important economic crop in Nigeria, however, little is known about the diversity inherent within, and the genetic relationship among coffee grown and conserved in the country. We examined the genetic diversity and relatedness among 48 Coffea genotypes which included: (a) C. arabica, C. abeokutae, C. liberica, and C. stenophylla, (b) 14 C. canephora accessions conserved in the germplasm of Cocoa Research Institute of Nigeria (CRIN), and (c) 30 farmer-cultivated genotypes collected from South-Western Nigeria. By analyzing 433048 single nucleotide polymorphisms (SNPs) identified through genotyping-by-sequencing we discovered that previous characterizations of C. canephora based on morphological data were inconclusive. Here, we established the correct number of C. canephora varieties present in the CRIN genebank which was four and not six as previously described based on morphological characters. We found three distinct diversity structures within the C. canephora genepool that were dominated by a single genetic group determined from passport descriptors to most likely be of Congolese (Democratic Republic of Congo) origin. High uniformity was also found among the farmer-cultivated accessions with 99% of them representing C. canephora var. Niaouli as their ancestral background. The analysis showed that the genetic base of coffee germplasm in Nigeria is narrow compared to the large genetic diversity of C. canephora. Therefore, broadening this genetic base through future acquisition and hybridization is imperative. However, the relatively high genetic differentiation (FST estimate = 0.3037) identified between Java Robusta and Niaouli will be used as a starting point for our breeding program.
Coffee with co-workers: role of caffeine on evaluations of the self and others in group settings
This research explores the effect of consuming a moderate amount of commercially available caffeinated coffee on an individual’s self-evaluated participation in a group activity and subsequent evaluations of the experience. Across two studies, results show that consuming a moderate amount of caffeinated coffee prior to indulging in a group activity enhances an individual’s task-relevant participation in the group activity. In addition, subjective evaluations of the participation of other group members and oneself are also positively influenced. Finally, the positive impact of consuming a moderate amount of caffeinated coffee on the evaluation of participation of other group members and oneself is moderated by a sense of an increased level of alertness.
Evaluating the effect of shade trees on provision of ecosystem services in intensively managed coffee plantations

Intensively managed cropping systems with emphasis on productivity of the main crop can benefit from additional ecosystem services brought by integration of trees in the system − but potential drawbacks must also be accounted for. In an on-farm study, we used a variety of plant, soil and water- related variables to assess the effect of Erythrina spp. and Musa spp. on the provision of ecosystem services in productive, high-quality Coffea arabica plantations in Costa Rica. We found 1) no significant effect of shade trees on coffee production overall; 2) evidence that shade trees do affect flowering and subsequent cherry development, with effects strongly dependent on climate and annual variations in coffee plant physiology; 3) Erythrina shade trees significantly increased soil litter and relative infiltration rate of water in the soil, both linked to soil conservation and decrease in erosion; 4) even in highly fertilized environments, Erythrina trees do fix N which was taken up by adjacent coffee plants. The lack of significant negative effect of shade trees on overall coffee yield and the observation of the provision of other useful services was not unexpected, because of 1) the low density of shade trees in the study site (100–350 trees/ha pruned twice a year on average) and 2) the sensitivity of coffee yields to other interacting effects such as climate, pests and diseases and physiological variations in the plant. Pending further long-term research into the factors affecting coffee yield, we find shade trees provide sufficient ecosystem services to justify their integration in even intensively managed plantations.
Using Single Free Sorting and Multivariate Exploratory Methods to Design a New Coffee Taster's Flavor Wheel
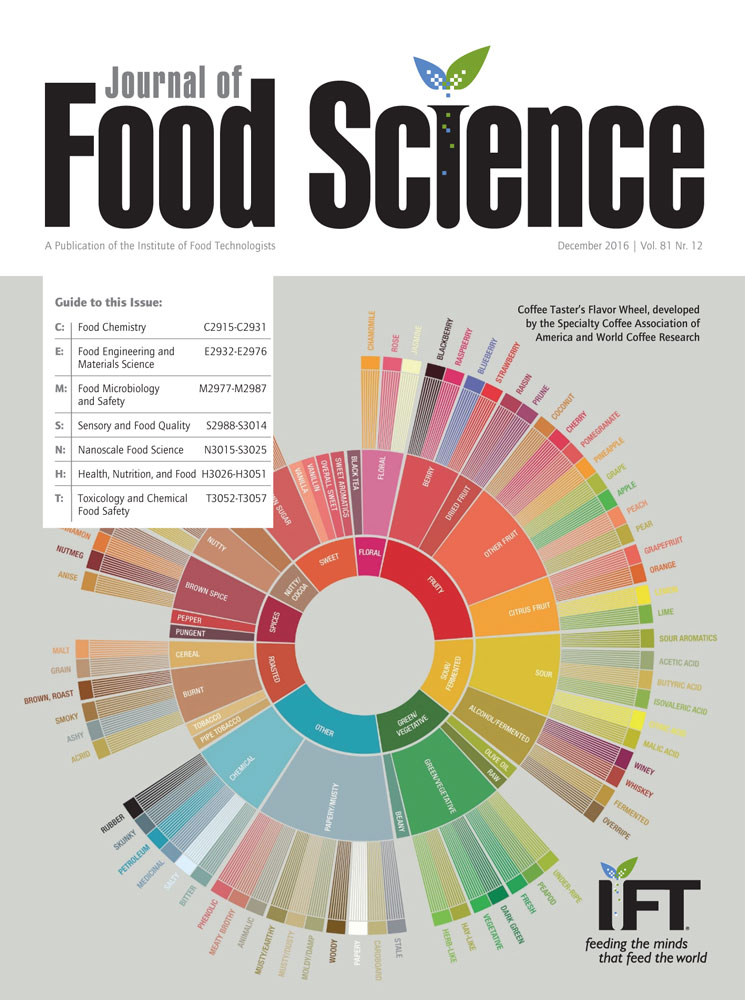
The original Coffee Taster's Flavor Wheel was developed by the Specialty Coffee Assn. of America over 20 y ago, and needed an innovative revision. This study used a novel application of traditional sensory and statistical methods in order to reorganize the new coffee Sensory Lexicon developed by World Coffee Research and Kansas State Univ. into scientifically valid clusters and levels to prepare a new, updated flavor wheel. Seventy‐two experts participated in a modified online rapid free sorting activity (no tasting) to sort flavor attributes of the lexicon. The data from all participants were compiled and agglomeration hierarchical clustering was used to determine the clusters and levels of the flavor attributes, while multidimensional scaling was used to determine the positioning of the clusters around the Coffee Taster's Flavor Wheel. This resulted in a new flavor wheel for the coffee industry.
Coffee response to nitrogen and soil water content during the early growth stage
Coffee (Coffea arabica L.) is the major crop grown in highland and mountainous areas of Colombia, where the most common yield‐limiting factors are nitrogen (N) and soil water content. Since the eventual success of a plantation is determined by the performance of coffee plants during critical early stages, our goal was to better understand plant response to these limiting factors. Four different levels of N and soil water content were evaluated under greenhouse conditions for their effect on growth, water use efficiency, fertilizer‐N recovery efficiency (FNRE), and stem lignin and cellulose of coffee seedlings.
The interaction between N and moisture did not produce a significant response in coffee growth. However, by increasing N, both water use efficiency and 13C content were enhanced, while growth, recovery of urea by plants, and stem strength were decreased. Water stress due to low soil water content increased water use efficiency, 13C content, and root to shoot ratio, but decreased shoot growth.
These results demonstrate the effects of N supply and water balance and highlight the excessive amount of N typically applied to coffee seedlings as well as the importance of the acclimation process of young plants to changes in soil N and water. All of these are important considerations in improving management strategies to reduce environmental impact while sustaining optimal productivity.
Effects of solution pH, temperature, nitrate/ammonium ratios, and inhibitors on ammonium and nitrate uptake by Arabica coffee in short‐term solution culture
Solution pH, temperature, nitrate (NO3 ‐)/yammonium (NH4 +) ratios, and inhibitors effects on the NO3 ‐ and NH4 + uptake rates of coffee (Coffea arabica L.) roots were investigated in short‐term solution culture. At intermediate pH values (4.25 to 5.75) typical of coffee soils, NH4 + and NO3 ‐ uptake rates were similar and nearly independent of pH. Nitrate uptake varied more with temperature than did ammonium. Nitrate uptake increased from 0.05 to 1.01 μmol g‐1 FWh‐1 between 4 and 16°C, and increased three‐fold between 16 to 22°C. Between 4 to 22°C, NH4 + uptake rate increased more gradually from 1.00 to 3.25 μmol g‐1 FW h‐1. In the 22–40°C temperature range, NH4 + and NO3 ‐ uptake rates were similar (averaging 3.65 and 3.56 umol g‐1 FW h‐1, respectively). At concentrations ranging from 0.5 to 3 mM, NO3 ‐ did not influence NH4 + uptake rate. However, NO3 ‐ uptake was significantly reduced when NH4 + was present at 3 mM concentration. Most importantly, total uptake (NO3 ‐+NH4 +) at any NO3 ‐/NH4 + ratio was higher than that of plants fed solely with either NH4 + or NO4 ‐. Anaerobic conditions reduced NO3 ‐ and NH4 + uptake rate by 50 and 30%, respectively, whereas dinitrophenol almost completely inhibited both NH4 + and NO3 ‐ uptake. These results suggest that Arabica coffee is well adapted to acidic soil conditions and can utilize the seasonally prevalent forms of inorganic N. These observations can help optimizing coffee N nutrition by recommending cultural practices maintaining roots in the temperature range optimum for both NH4 + and NO3 ‐ uptake, and by advising N fertilization resulting in a balanced soil inorganic N availability.
At What Temperatures Do Consumers Like to Drink Coffee?: Mixing Methods
 Three hundred consumers were required to mix a hot and a cooler coffee together until it was at a desired temperature for drinking. They added creamer and sweetener to taste. In a 2nd experiment, 108 consumers performed the same experiment with black coffee only, but repeated it using different coffee strengths. In all experiments, the chosen mean preferred temperature for drinking was around 60 °C (140 °F). Black coffee drinkers chose a slightly higher mean temperature than drinkers with added creamer, and they also chose a slightly lower mean temperature when the flavor was stronger. In all cases, consumers tended to choose, on average, temperatures for drinking coffee that were above the oral pain threshold and the burn damage threshold.
Analysis of volatile components isolated from Hawaiian green coffee beans (Coffea arabica L.)
 Volatile components isolated from Hawaiian green coffee beans (Coffea arabica L.) were identified by gas chromatography (GC) and gas chromatography–mass spectrometry (GC–MS). The mass of total volatile components recovered from 200 g C. arabica beans was 2.7 ± 0.3 mg. The volatile components identified in this extract were: ten alcohols, four aldehydes, one ketone, one lactone, three heterocyclic compounds, two hydrocarbons, and two miscellaneous compounds. The major constituents were 3‐methyl butanoic acid (32.8%), phenyl ethyl alcohol (17.3%), hexanol (7.2%), 4‐hydroxy‐3‐methylacetophenone (3.7%), and 3‐methyl butanol (3.6%). Heterocyclic compounds, important components in providing coffee with their characteristic flavours, were not found in the extract from green coffee beans, except for 2‐methoxy‐3‐(2‐methylpropyl)‐pyrazine.